For what it is worth, Hungary's rate of unemployment is now running at 7.0% year on year. This is the figure of the May-July period, but it remains unchanged from the previous three-month period, according to the latest report from the Central Statistics Office (PDF).
Now this in itself is strange. Hungarian economic activity is dropping steadily, we may well be going into a recession, yet the unemployment rate hardly seems to be moving. The 7.0% jobless rate (a figure which is even down from the 7.3% March-May rate), is in fact the lowest rate to be achieved since the end of 2004. The following graph shows the evolution of Hungarian unemployment

The KSH state that the number of unemployed in the May - July period was 296,700 and the number of employed 3.949 million. This latter number is a slight drop from the 3.943 m registered in April-June. At the same time the number of unemployed dropped by 5,800 from the previous 3-m period and remained largely unchanged year on year with the same period in 2006. The jobless rate for the 15-24 year old group, which represents 17.8% of all unemployed, was 16.8%, and this was down 1.7 percentage points from the same period last year.
So what is happening here? Well basically Hungary is getting older, and the working age population is starting to fall, that's what seems to be happening. First off here is a graph which shows the actual numbers of unemployed people in Hungary since the start of 2006.

Now lets take a look at the 15 - 64 age group, over the same period. As we can see, in general terms it is dropping steadily.
 The employed population in this age group is fluctuating. It seems to have touched bottom in January/February 2007, and to be now increasing again. Given that the economy is slowing considerably while this employment expansion is taking place, one prima facie conclusion would be that productivity is not rising, and may well be slowing, since with more people working and more productivity the economy should accelerate, not slow. Of course one other possibility is that the average number of hours worked per capita is reducing - no overtime etc - and this is a possibility I will try and explore.
 When it comes to the age composition of the labour force we can also notice something interesting. Obviously the majority of the workforce are - at this point in time - in the productive age groups between 25 and 55. But it is also interesting to look at participation rates in the groups outside this age bracket, to see what is happening, and what the future has in stor. Below I have made a chart showing the numbers of people in the 65-74, 60-64 and 15-24 age groups. Now what is clear is that these two latter groups are expanding - this is what an ageing workforce means - while the latter, youngest group, is contracting.
 This contraction in the 15 to 24 age group can be for a number of reasons. In the first place it is simply a reflection of the fact that there are progressively less and less people in this age group, as can be seen in the next graph.
But even of those who there are in this age group, given that Hungary wants to become a more modern, productive, economy, it is only to be expected that a growing percentage will seek to achieve a higher level of education and training, and this again is reflected in the graph below which show the participation rates for the three groups we are looking at.

So what is apparent is that while the participation rate for the 15 - 24 group has been falling, the rate for the older groups has been rising steadily. This is only to be expected, since raising the participation rates of the the older groups is one of the only ways (outside immigration) that Hungary is going to be able to find extra labour force in the future, plus of course with the fiscal reductions there will be less available in the way of retirement pensions, so it will become normal that people have to work longer.
So is all, in this case well, that ends well. Well not really, since there is productivity to think about here. It is not my intention to be ageist, but a person in the 65-74 group is not productively equivalent to a person in the 40 to 50 group, and this is the swap that countries like Hungary will soon be making.
In conclusion I would like to mention the fact that Hungary might have something to learn from the case of Japan. In order to try and explain what I am getting at, here's a convenient graph of Japanese economic growth 1955 to 2003 prepared by US economist Michael Smitka from Japanese data available here.

What is obvious from looking at this growth profile is that Japanese growth has been far from uniform over the last 50 years or so. This really shouldn't be so surprising when we think about economic theory a little. Key components of economic growth are the proportions of the total population working, and the kinds of activities they are engaged in. Now if we look at the early part of the graph we can see very high growth rates (which we can also find in eg China, and some parts of Eastern Europe - not Hungary unfortunately - right now). This is know as "catch up" growth, and is due in one part to an ever greater part of the total population becoming involved in economically productive activity, and in the other to a technological (productivity driven) 'catching up' process. As developing countries tend to start at some distance from the existing technological frontier then growth can be proportionately more rapid as they close the distance (again this process can be seen now across the Eastern European EU accession economies).
However - and this is the important point for us here - with time this growth spurt eventually slows, although the loss is to some extent offset as societies generally move up the median age brackets (in the standard cases from median ages of around 30 to median ages in the 35 to 40 category, but this is exactly where Eastern Europe is so very different from the standard case) and by a growing importance of what have come to be known as 'prime age workers' (ie workers in the 35 to 50 age category, just where Hungary is now). A reflection of this prime age wage/productivity effect can be seen in the chart below which shows how the age related earnings structure has altered in Japan over the years between 1970 and 1997.
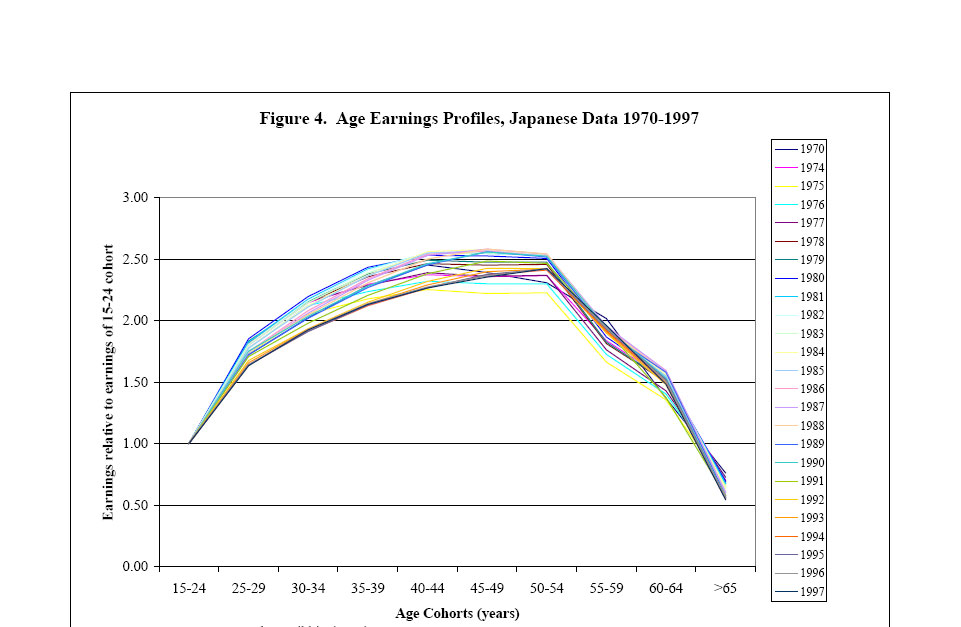
The most important point to note is that wages generally peak somewhere in the 50-54 age range (even though, as a result of the accelerated ageing process which has taken place there many workers in Japan now continue to work up to the age of 75and beyond). The point here is that this individual wage profile may be considered to be some sort of kind of proxy representation for what actually happens to productivity performance of an entire population as it ages. One very revealing detail is that while the shape of the hump has changed somewhat over the years there has been little noticeable drift to the right, which should give some indication of the extent of the age-related productivity problem. Indeed in Japan, as more and more workers have come to belong to the older age groups, aggregate wages at first stagnated, and have now begun to trend down.
OK, this was just an initial exploration. There is no conclusion. Now we need to follow what happens and see how all this works out over time. There are a lot of theories about ageing knocking about all over the place. Now we are going to get to see what the reality actually is.


3 comments:
This may be a bit of an off-topic comment, but I'm going to give it a try:
You provided some great statistics and images in this post; they'll be very helpful to me as a I work on a project regarding demographic change in Hungary. I noticed these come from a government office; would you be able to note any non-profit or special interest groups that also make use of these? I'm specifically examining Hungarian lobbying in the EU regarding demographic change, fertility, etc.
Any suggestions are appreciated--thanks!
Hello Meg,
"I noticed these come from a government office; would you be able to note any non-profit or special interest groups that also make use of these? "
Yep, they come from the statistics office, ro from Eurostat, or from the UN, or the US census bureau. I can't really help you localise NGOs which are interested in this topic. I am sure they exist, but I haven't been able to find that many people who connect the demographic issues in Hungary have with the economic problems they are having. If you find any please let me know.
"I'm specifically examining Hungarian lobbying in the EU regarding demographic change, fertility, etc."
This is clearly a monster issue that is looming, and all I can do is wish you luck.
Cheers,
Edward
By the way, we also run a blog called Demography Matters, you might find some of the post we have there on Eastern Europe useful.
Post a Comment